 home
home
Appendices
1. Character strings in a graph
- You can display a label of x, y and z axis, and an explanatory note (legend) in a graph.
2. Preservation of a gragh image
Windows (using Paint)
- When you select in order of "Edit"->"Copy" in the menu bar of the
graph display, the graph image can be copied onto the clipboard.
- Next, when starting the Paint
and selecting from the menu bar of the Paint in order of "Edit(E)"->"Putting (P)", the image is put on the Paint.
- The graph image can be preserved by a suitable file format (jpeg
and png, etc.) when you select
from the menu bar of the Paint in order of "File (F)"->"Preserve it giving a name (A)".
Macintosh (using Preview)
- When you select in order of "Edit"->"Copy" in the menu bar of the
graph display, the graph image can be copied onto the clipboard.
- Next, when starting
the Preview and selecting from the
menu bar of the Preview in order of "File"->"New make from the clipboard", the image is put on the Preview.
- The graph image can be preserved by a suitable file format
(jpeg
and png, etc.) when you select
from the menu bar of the Preview in order of "File"->"Preserve it
by the alias".
Linux, Windows and Macintosh (using OpenOffice)
- When you select in order of "Edit"->"Copy" in the menu bar of the
graph display, the graph image can be copied onto the clipboard.
- Next, start the OpenOffice, and select graphic depiction (B).
- Select from the menu bar in order of "Edit"->"Putting (P)", and
put the image.
- The graph image can be preserved by a suitable file format
(png
and eps, etc.) when you select
from the menu bar in order of "File"->"Export (T)".
3. Function model fitting
Click here for the function model
fitting.
Fit summary
- The "correction norm" is the value of the norm of the correction
vector. It is the value of the norm
 , where
  (i=1,2,...,m) is the elements of the correction vector which
corrects the parameter pi (i=1,2,...,m).
(i=1,2,...,m) is the elements of the correction vector which
corrects the parameter pi (i=1,2,...,m).
- The "damping factor" is the value of the additional factor
 of
the diagonal elements in the curvature matrix in the normal
equation in (Levenberg-)Marquardt method. The value of the is
desirable to be 0. If the value of the is not 0, adjust the
initial values of the parameters and try to fit again.
of
the diagonal elements in the curvature matrix in the normal
equation in (Levenberg-)Marquardt method. The value of the is
desirable to be 0. If the value of the is not 0, adjust the
initial values of the parameters and try to fit again.
- The "probability" shows the probability
 in the chi-square
distribution that the value of the
chi-square
in the chi-square
distribution that the value of the
chi-square  exceeds the observed
chi-square
exceeds the observed
chi-square  for a correct model.
- The residual is defined as the difference between the observed
value yi and
the function value f(xi) corresponding to x
value for the observed value,
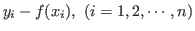 . The sum of the suqared residuals(SSR) is
also defined as
. The sum of the suqared residuals(SSR) is
also defined as 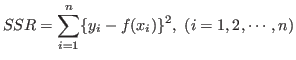 .
.
- The "root mean square(RMS)" is defined as the square root of the sum of
the squared residuals(SSR) divided by the number of degrees of
freedom(ndf),
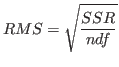 .
This is a measure of the standard deviation of the residuals.
.
This is a measure of the standard deviation of the residuals.
4. Multiple linear regression
The multiple linear regression model assumes that the statistical
relationship between the response variable Yi and the explanatory
variables xij is of the form
 ,
,
 ,
where
,
where  (j=0,1,2,...,k) are
the regression parameters, xij(i=1,2,...,n,
j=1,2,...,k) the explanatory variables,
(j=0,1,2,...,k) are
the regression parameters, xij(i=1,2,...,n,
j=1,2,...,k) the explanatory variables,  denotes the independent normal random variables with zero mean and
common variance
denotes the independent normal random variables with zero mean and
common variance  .
.
Click here for the multiple linear
regression more.
Kazushi Neichi
Department of Business Administration, Tohoku Gakuin University